
Showing posts with label Peter Katsingris. Show all posts

Jul 11, 2019

Nielsen’s Latest Total Audience Report Reveals a Surprising and Challenging Future

Nielsen’s Latest Total Audience Report Reveals a Surprising and Challenging FutureIf one could ascribe a word to describe the findings from the latest Nielsen Total Audience Report, it would be “surprising.”  The report not only reaffirmed some of the basic trends in consumer media usage, it also revealed some new usage behaviors from content choice to demographic stratifications to hardware and software adoption.
Peter Katsingris (pictured at top), Senior Vice President, Nielsen Audience Insights, described the current media environment as one that “changes quickly. There is always something new that pops out, especially when we include other Nielsen data sets that have not been included in this report before.”  One example of this was the addition of moviegoer data that tended to skew younger.
Media companies cannot afford to be complacent in this ecosystem. Consumers’ appetites for media are continuously evolving, according to Katsingris, who reported that consumers spend over 11.5 hours a day on media. “That’s almost half a day,” he said. “Clearly, most of their awake time is connected one way or another.”

Video discovery was an “ah-ha” moment, based on new data. “We definitely found this data surprising with respect to the consumer journey,” Katsingris noted. The report revealed the decision-making process viewers undertake when choosing content. “We asked questions, like ‘Do you know what you are going to watch before you actually watch’ and ‘What action did you take to decide what to watch?’” he said, adding that almost two-thirds of adults know exactly what they want to watch most of the time, while one-third have a general idea and about a quarter weren’t sure.  Ultimately, he said that 58% indicated they would view their favorite traditional channels if they couldn’t make a decision.

The amount of time we spend searching was also interesting to Katsingris. Viewers spend time scanning options, “and we realized that eight minutes of time went by before they made a decision. That is eight minutes of browsing through menus to see if something catches your interest.” He suggested that content owners need to [stand out in] these early stages of consideration and cut through this clutter “to make sure that what they are offering stands out from everything else.” One way to do this is to make sure that their content is available across all services, platforms and devices.
For those who didn’t really know what they wanted to watch, their content search revealed that “what ranked the highest was search that could be done via the remote to quickly look through your favorite channels.  People tend to rely on what is familiar to them to get them through this time of choice.” The search activities that stood out “were those tuned to favorite channels, scanning through the traditional TV channels, going through the program guide, then browser menus on subscription services,” he revealed. These choice orders varied somewhat by age, with younger viewers searching subscription services more than overall adults.

Interestingly, the report indicated that “recommendations from service providers were less likely to influence viewers on what to watch.” Further, 21% opted out of viewing altogether when they couldn’t find anything to watch.

Voice Assistants and Smart Speakers
Technology is not only driving video search partners; it’s also impacting how users engage with voice assistant technology. Voice assistants are used by 36% of all adults. “It’s found everywhere from your smart speakers to your smartphones,” Katsingris noted. “Even my cable remote has voice assistance as well to help me find content. It’s an enabler to allow consumers to get answers quickly and access content, and also, with IoT, control things like lights in the home and your car, hands-free.”
Since smart speakers launched a few years ago, their adoption and the amplification of audio content has continued to rise. Smart speakers are now found in 28% of all households, and because of their hands-free convenience, Katsingris believes that they are replacing other functions that devices had. “As consumers acquire these devices, their capabilities will continue to grow, and ownership will expand exponentially with their use,” he said. Most usage is music and weather, “but, according to our MediaTech Trender Survey data, we see that nearly all smart speaker owners, about 95%, report listening to music on their devices,” he continued. “It’s potentially taking away users who listen to music on their smartphones, TV sets or on tablets.” The top listening formats for smart speakers were music, podcasts, sports updates and shopping online. And, he noted, some people just like to chat with these devices. “Seventy-seven percent report that they just like to talk to them for fun.”

The Future
For Katsingris, the future for media companies is at once challenging and opportunistic. “Consumers continue to engage with media across all of the platforms,” he explained. “It’s at their leisure. It’s on demand for a good part of the day with some demographics more than others. So, it’s really important to know who is using which platform and how much more than others to reach your desired demographic. I just hope younger generations know the old way of doing things as well and aren’t depending on things being done for them.”

This article first appeared in www.MediaVillage.com

Jul 2, 2019

Nielsen Reveals the Trends in American Video Consumption

According to the most recent Nielsen Total Audience Report, viewers are essentially creatures of habit. Overwhelmed by ever increasing content choices, Nielsen has found that viewers tend to stick with their familiar favorite shows. But, as Nielsen points out, as much as this is difficult for consumers, it is equally if not more difficult for content creators, programmers, platforms and marketers. “After all, if their efforts fail, consumers spend more time searching and less time consuming,” the report states.

Here are the takeaways:
  • Almost two-thirds of adults who stream video content are likely to watch when know exactly what they want. One-third will watch when they have a rough idea and only 22% watch when they don’t know what they want before diving into the options.
  • When faced with a decision of what to watch, 58% of users said they were more likely to go back to their favorite traditional channels if they couldn’t make a decision, 44% will scan through traditional channel options, 39% scan the program listings and 31% browse their DVR recordings.
  • SVOD users are less likely to scan their subscription content menus. Only one-third of adult respondents say they browse their SVOD content menus for more content, while 21% say they would simply opt out of watching anything if they couldn’t choose.
  • U.S. Adults have a large overall cross-media diet, spending 11 hours and 27 minutes per day interacting with media, up 21 minutes of additional media exposure across all platforms compared to 1Q2018.
  • Video viewing through TV-connected devices increased by 8 minutes daily, and as consumers replace old TV sets with TV screens preloaded with connected options, they’re adopting smart lifestyles.
  • Seven in 10 homes now have a subscription video on demand (SVOD) service and 72% use streaming-capable TV devices.
  • The group most susceptible to indecision is Adults 18-49. Younger adult viewers 18-34 are more likely to explore different viewing options. They’ll flip through menus, check out programs that have been recommended for them and step outside their traditional content comfort zones. But they also tend to rely on another “extreme” route, as they are reported to tune out all together at higher levels compared to other demos. They are also increasingly moving off the glass, spending over half of their daily media usage with digital media such as computers, smartphones, and tablets.
This article first appeared in Cynopsis

May 10, 2019

How to Get Personal, According to Nielsen

How to Get Personal, According to Nielsen "Marketers have to get personal," and should explore technological opportunities, according to Peter Katsingris, Senior Vice President, Nielsen Audience Insights (pictured at top).  

He kicked off the recent Nielsen press breakfast with additional personal touches added by Kelly Abcarian, Nielsen's Senior Vice President, Watch Product Architecture, and other speakers to highlight how the organization is keeping pace with the evolving media landscape via its own technological advances.
Presentations illustrated platform and device usage trends, preferences by demographic, ad-supported potential, dynamic ad insertion and how clients are using Nielsen's data to demonstrate TV's opportunities for advertisers, as summed up here:

The Trends:  More Time Spent with Digital Media
Katsingris has a team that "tells stories with data," enabling clients to better understand the impact of how consumers are leaning into content. "Marketers have to get personal," he noted, and should explore technological opportunities such as dynamic ad insertion to better reach consumers who are increasingly spending more time on their personal devices and various platforms.  He reported that, overall, weekly usage of media continues to grow.  In 2018, Nielsen found that viewers spent 79 hours with media per week, compared to 61 hours in 2010 and 51 hours in 2002. Multi-tasking contributes a lot of this extraordinary amount of time spent, as smartphones have surpassed radio and time spent with digital devices in general, reaching parity with time-shifted TV.

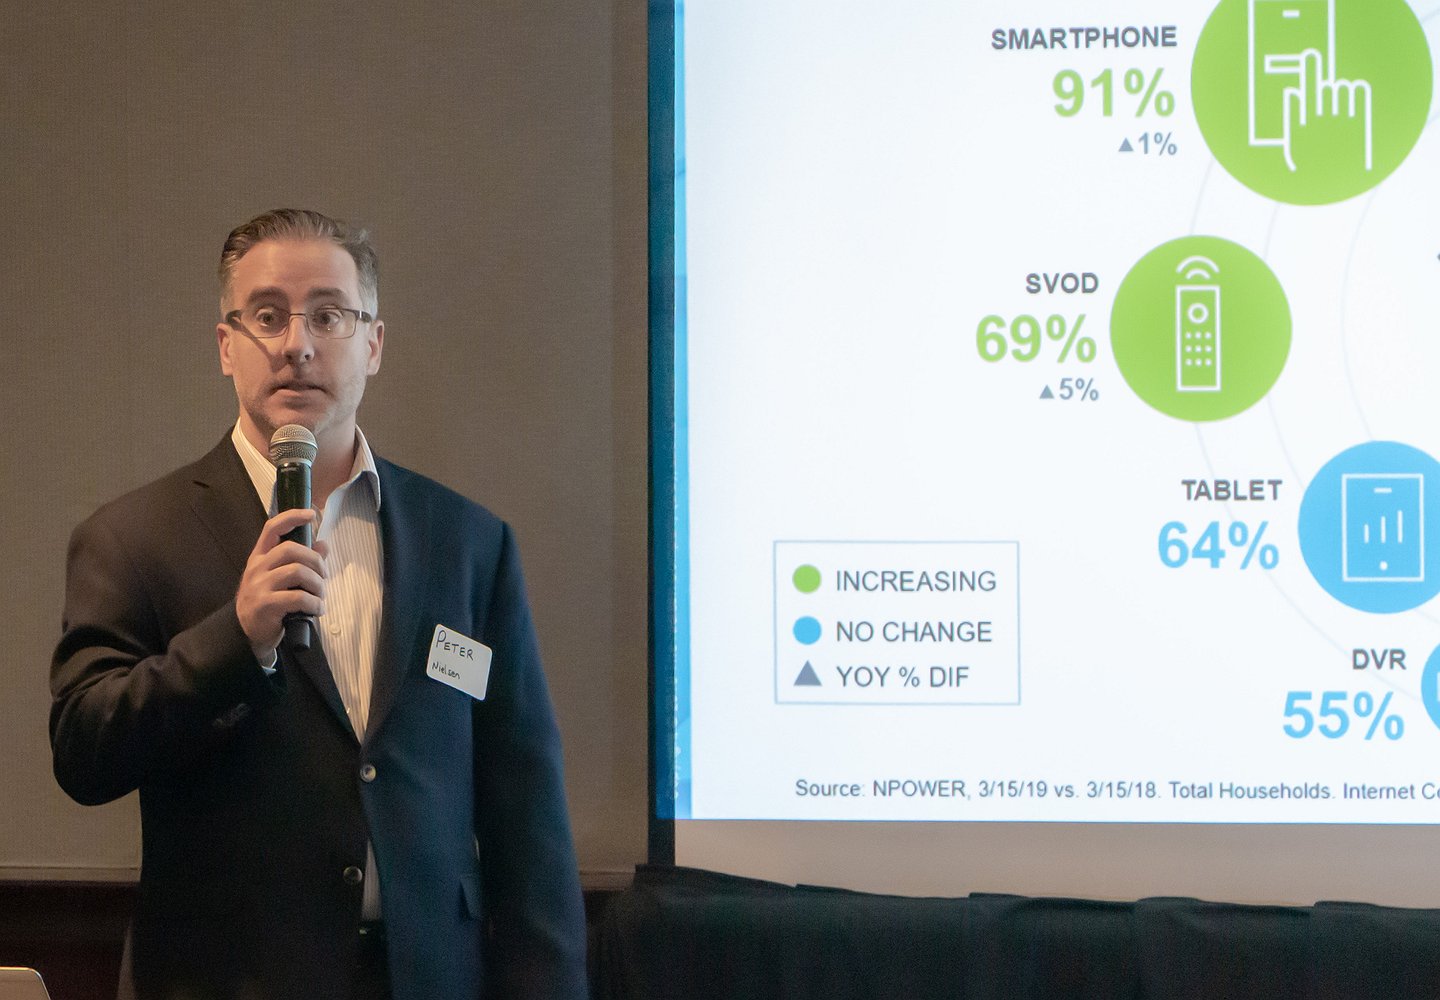
New platforms and devices are being adopted at impressive rates.  According to N-Power, in March 2018 91% of all U.S. households had a smartphone, 79% a computer, 69% an SVOD service, 64% a tablet, 55% a DVR, 46% a smart TV, 43% a game console, 40% an internet-connected device and 4.8% a virtual MVPD.  This increase in digital adoption has resulted in increased usage.  Overall, media usage increased +21% from January 2018 to 2019, especially among African Americans (+26%), Hispanics (+23%) and Asians (+38%).

The more opportunity to view on various devices and platforms, the more time is spent on them.  The shift in time spent is a cautionary tale for traditional media.  Once adopted, streaming usage grows from month one (1 hour, 8 minutes) to year one (1 hour, 20 minutes) while time spent with TV declined in the same timeline (from 7 hours, 19 minutes to 6 hours, 33 minutes).

The expansion of the data pool enables Nielsen to offer new and interesting ways to analyze usage, including which devices are used in which room in the house.  Enabled smart TVs tend to reside in the living room (53%) and encourage co-viewing, while internet-connected devices are in the master bedroom (26%) and (unsurprisingly) enabled video game consoles are in bedrooms that tend to belong to younger members of the household (32%).

The Opportunities:  Addressable TV Using ACR
"The time for addressable advertising is now," declared Abcarian.  "TV has changed and grown.  But we need to look at TV differently than in the past."  There is more connected TV ownership (+46% have at least one smart TV in the home, representing +8% growth from January 2018 to January 2019) and greater cord-cutting or shaving (25% of all TV homes).  But don't misread the trends, she advised.  "TV time is growing, not shrinking," because viewers are "using other devices to get to the glass."  In fact, the impact of connected devices is influencing linear viewing, offering a rebirth of TV.

Linear content is experiencing a 5-7x growth with internet-connected devices, while smart TVs provide a 2x growth to linear content.  In this environment, the ability to apply addressable advertising is a boon to advertisers.  It offers precision advertising that highly targets linear TV with advanced demographics.  It provides value targeting that enables agencies to reduce waste and, with Nielsen, "best in class measurement," using "similar audience segments definitions."  To that end, Nielsen is pioneering ACR technology to unlock the full 16 minutes of ads in programming and transforming C3 measurement, so as to enable clients to reconcile with addressable and be able to execute ad models across platforms.

Two main areas of focus in the coming months include audience-based buying to enable advertisers to use advanced audience segments to plan and buy linear TV campaigns, and addressable TV, which offers true one-to-one ad targeting, delivery and measurement across smart TV platforms. The result will be greater measurement transparency and standardization across these two areas. One example of industry collaboration that exists today is between Nielsen and OpenAP. Nielsen's audience data and Enterprise Audience API are used within OpenAP, enabling the buy side to create and share 777 segments within the consortium's platform since it launched in the Fall of 2017.

Part of this is the result of Nielsen's ability to deploy dynamic ad insertion, which is now in the testing stage.  Nielsen uses video ACR technology that is embedded in the glass screen's firmware or chipset.  "We then take a screenshot every half-second to see what is watched on-screen every two seconds," Abcarian explained.  This is matched back to the library and a decision is then made whether or not to replace the original network ad based on pre-arranged rules and audience profiles.  "It is a seamless experience for the viewer and is more engaging because it is a more relevant ad," she said.

The early learnings from this pilot indicate that broadcasters want to see improved sell rate percentages and agencies want accurate forecasts and more standard segments.  For all of this to happen, measurement reconciliation needs to occur, as well as some operational improvements; there are still too many manual processes at the current time to deliver addressable campaigns.  Some of the challenges are the result of walled gardens that "tie up addressable at scale," Abcarian said.  "We need more partnerships in the ecosystem."  She also noted that we need more scale in technology while keeping in mind the privacy that goes with it.

Another challenge is "too many demand pools and measurement sticks," she added.  "We don't know how to buy at scale with confidence."  Further, there needs to be a reconciliation with C3, bringing the measurement holistically across platforms.  Finally, there needs to be education.  "What do we mean by addressable TV?" she said by way of example.  "And, [we have to] put a value against the impressions."

Ultimately, Abcarianis bullish on Nielsen's ability to deliver an addressable product that will be embraced by the industry.  "It offers real-time scale that optimizes both the upper and lower funnel," she noted.  Nielsen is focused on creating a standardization framework that will drive consistency across all platforms.

This article first appeared in www.MediaVillage.com

Aug 19, 2018

Peter Katsingris Offers Insights From Nielsen’s Total Audience Report

Add caption
“Consumers have never been more connected than they are today,” stated Peter Katsingris, SVP, Nielsen Audience Insights. “Media consumption is no longer restricted to the living room but follows them wherever they go with the content of their choosing always within reach.”  

With Americans now spending an astounding 11 hours per day using media, according to Nielsen, the stakes for media companies and advertisers is high to insure that their messages are reaching the right audiences at the right time on the right platform through the right device. Nielsen has been diligently tracking consumer usage so as to offer their clients a more accurate look at how today’s consumers are navigating their ever growing media choices.

How will all of this impact the future of media? Katsingris offered his insights into the latest Nielsen Total Audience Report:

Charlene Weisler: How can half of the average American's day be filled with consuming media? Certainly there is a lot of multi-tasking but what about de-duped usage?

Peter Katsingris: Within the 11 hours per day of media usage there is some amount of simultaneous usage across devices.

Charlene Weisler: Where is the greatest growth coming from? How will this impact future usage?

Peter Katsingris: The greatest growth is among TV-Connected device use, whether it is the smart TV or other connected-devices that enable streaming content to the TV set. Streaming will continue to grow as the way people consume content through the TV glass evolves.  Additionally, digital device usage, particularly smartphones, is growing as consumers continue to personalize their media use. The options available to the consumer will result in a more “on-demand”, a la carte experience that consumers can access media anywhere and through whatever device is most convenient to them at that time. 

Charlene Weisler: TV looks to be consistently #1 in time usage. Do you see that continuing?

Peter Katsingris: It’s often said that TV is dying, but our data paints a different picture. People spend a lot of time in front of the TV set, whether it is Live, watching recorded content via their DVR or on-demand or even a subscription service through a TV connected device. Linear TV viewing continues to remain a substantial portion of the overall share of media usage.  But it varies by demographic.  Younger adults spend less time with linear than older adults and television accounts for a smaller percentage of that time.  However, they still watch television and will continue in one form or another.  

Charlene Weisler: Younger viewers are consuming less live TV. What are the long term implications?

Peter Katsingris: Younger generations have always been early adopters. With viewing content, early adoption means young people are engaging with platforms and devices that drive new habits, however, some of these new ways to connect still end up with a young consumer in front of a TV. 

Charlene Weisler: How much streaming is happening to the TV? 

Peter Katsingris: Consumers are incrementally spending more time on the television set streaming content. Overall, based on the Q1 2018 Nielsen Total Audience Report, half of adults 18+ are using TV connected devices (DVD/Blu-Ray, Game Console, Internet Connected Devices, Smart TV apps) to watch or use media content and that accounts for nearly 10 hours a week. Using Nielsen’s Streaming Meter we have a more complete understanding of streaming that’s occurring to the TV set. What we see is that among homes that have that ability, one out of every 10 minutes for adults was streaming content to the television set. Younger consumers having a higher percent of streaming of overall total TV usage.

Charlene Weisler: Which devices are consumers using to stream to the TV? 

Peter Katsingris: Two-thirds of homes have the ability to stream content via internet enabled TV connected devices like game consoles, smart TVs or internet connected device (i.e. Apple TV, Roku, Google Chromecast, Amazon Firestick). Teens are more likely to use game consoles to stream while older adults use a smart TV.  Across all TV households, about a third only use one device and another third use more than one device, indicating the multiple options consumers have. Typically homes with multiple device use have a combination of a video game console with another streaming device.

Charlene Weisler: What are the overall SVOD trends that this report uncovered? 

Peter Katsingris: The report focused on access to the three main Subscription Video On-Demand services of Netflix, Hulu and Amazon Prime Video.  More consumers have and continue to want access to these multiple channel(s) in their home compared to last year. Among total households, access to these services is up to 64% of television homes in March 2018, from 58% a year ago. Similar to devices that enable streaming in the home, people have access to multiple services with 37% of television households having access to 2 or more of the services. 

Charlene Weisler: How is SVOD impacting linear TV consumption? 

Peter Katsingris: It’s hard to look at SVOD in a vacuum because streaming encompasses a broad array of services, including SVOD, AVOD (Advertising supported VOD) and Virtual MVPDs like Sling TV and Hulu Live. An underappreciated impact of SVOD is that it exposes consumers to a different way of accessing content, via menus, as opposed to traditional channel surfing. This translates into adoption of products (e.g. VMVPD’s) that provide those improved interfaces and easy app-based access. We are seeing that with homes subscribing to those services. Also, SVOD provides extra channels to choose from and when there is more choice, it impacts behavior and impacts traditional linear services. Prior research has shown that once someone acquires a device capable of streaming content, there is a change traditional TV use. However, people will continue to watch the programs they like regardless of additional content services they subscribe to and use them to complement current behaviors.  

Charlene Weisler: How can linear TV companies use SVOD to inform their business strategy? 

Peter Katsingris: I’m not sure there is such a thing as a “linear TV” company any longer. Every one of our clients has a cross-platform strategy to reach their consumer, wherever that consumer is. Last year we launched Nielsen SVOD Content Ratings. This allows our clients-- studios, networks and others-- to see how their SVOD programming is performing as well as how this content may be impacting their linear businesses or even help with decisions around scheduling and licensing.

This article first appeared in www.MediaVillage.com
 

May 1, 2018

Ad-Supported Media Continues to Rule


While today’s media consumers have a greater choice of content through ad-free or ad-blocked environments, the belief that ad-supported media is on the decline is just not true, according to a recent study by Nielsen. 

Nielsen announced that despite the changes in content availability through increased platform and device options, “over the last 15 years, ad-supported media is still far more dominant and successful than perception may indicate.”

Peter Katsingris, SVP Audience Insights, Nielsen, noted the following study highlights:

     >  86% of the share of time spent on media platforms for adults was with ad-supported content in 2017. This usage was relatively flat over the past decade off slightly from 2002 where the share  was 89%.

     >  Despite the proliferation of devices into the media ecosystem, engagement with ad-supported content has kept pace even as penetration percentages for newer platforms have grown.

     >  Time spent with ad-supported content has grown and maintained a consistent ratio with overall time spent. Consumers are actually spending more time with media, increasing by more than 25 hours between 2002 and 2017. 

I sat down with Peter and asked him the following questions:

Charlene Weisler: Any surprises in the results of the study?

Peter Katsingris: Sometimes the surprises come not in the change, but in the consistency. Not every study or analysis will have that percentage spike or huge growth in reach. I wasn’t particularly surprised by the findings, because I’m always analyzing media behaviors and we know that time spent by adults 18+ is still strong on radio and TV. However, between internet connected devices on the TV set as well as mobile digital devices, I do think there’s room for growth. As most of traditional television and radio are ad supported, it made sense that the majority of time would be spent on ad-supported content.  Thinking digitally, time spent on social media platforms also accounts for ad-supported platforms.  

Weisler: Why do you think ad-supported content continues to be popular?

Katsingris: I don't think consumers think about it that way.  They just want to read, listen, or watch their favorite channels, stations, apps or sites.  Most of those happened to be ad-supported, outside of some subscription based streaming services.  For publishers, advertising is a key part to their business and they continue to innovate how to create the best experience to help brands reach consumers and to bring relevance and value for consumers.  Who knows, maybe we will see non ad-supported content or platforms create alternative ad-supported models in the future as a way to create additional revenue streams.

Weisler: Is there a demographic component to the results – what is the relationship of younger viewers vs older viewers?

Katsingris: The data study was based on adults 18+, so I can’t speak to demographic differences in the context of this data exactly. Generally speaking, younger audiences are obviously more in tune with newer and nascent forms of media and interact differently than their older counterparts. They tend to be  more tech savvy and have a more diverse “palate” of consumption, so to speak, meaning that there’s an abundance of ways they can be reached. 

Weisler: How can ad-supported media continue to hold onto viewers?

Katsingris: I think this is a challenge for any content provider, ad-supported or not. It’s often said that “content is king” and I think that sentiment holds true in many instances. If something is produced that’s worth listening to, watching or reading, consumers will gravitate towards that. Advertising has to serve the consumer, and when it comes down to it, it’s all about delivering on relevancy and creating positive memories. 

Weisler: How much multi-tasking is going on and how does that behavior trend?

Katsingris: The study did not go into multitasking, but on a broader level, consumers are definitely interacting with more platforms and spending more time overall with media as well. I think that is why it’s important for marketers to have solid and pinpointed cross-platform and social strategies and for content to be measured across non-traditional channels, which is the value that Nielsen’s Total Audience framework brings.

Weisler: Where do you see ad-supported media going in the next five years?

Katsingris: It’s hard to answer and we don’t project forward, but based on this trend over the past 15 years, it has potential to stay in a similar range. It all depends on how the business models evolve and adapting to the changing landscape. The world of media and advertising has certainly changed, and there is definitely a multitude of new ways for people to interact with media and for brands to reach consumers. Ad-supported content has been a staple in the media industry for quite some time, which is a testament to how impressionable across decades it truly is. 

This article first appeared in www.MediaVillage.com

Jul 24, 2017

Welcome Generation Z: Nielsen Takes a Closer Look at Post-Millennials


No sooner is the media industry starting to understand Millennials than we are faced with another, younger generation of consumers and viewers. Nielsen refers to this post-Millennial group as Generation Z and focused its latest Total Audience Report (1Q17) on this younger, up-and-coming cohort. 

Why Generation Z? They are a large percentage of the TV and Total US populations, very diverse and, through their use of technology, are expanding the media usage footprint. According to Nielsen, Generation Z (which Nielsen defines as anyone under 21) is currently 26% of all persons in Total US TV Homes – the largest generation of individuals today - and when combined with Millennials, form almost half of the total US population. They are also very diverse, accounting for 22% of all Hispanics compared to previous generations. As a Nielsen press release states, “While generations like the Baby Boomers and Millennials are well known and add their own unique value to the media landscape, the lesser studied Generation Z is quickly maturing into adulthood and will soon make their presence known.” Indeed.


I sat down with with Peter Katsingris, Nielsen’s Senior Vice President of Audience Insights, to discuss the impact of Gen Z’ers on media:


Charlene Weisler: What are the major takeaways of the recent Nielsen Total Audience report on Gen Z?


Peter Katsingris: I think the most important thing to keep in mind is that Gen Z is the largest and most multicultural generation out of all the ones we looked at. Living at home – which they tend to - comes with perks: they have access to plenty of options for viewing content. Almost 3 out of 4 Gen Z’ers have access to an SVOD service and nearly all have some sort of TV connected or digital device to view content. They are growing up in an on demand world and have more choices available to them than prior generations.


Charlene: What makes them different from Millennials?


Peter: With these younger generations, it’s all about life stages. Millennials exist as adults now – they’re finishing up college, entering the workforce, moving out on their own, or starting a family. They are trying to earn a living and figure out what they can - or can’t - afford. They are at different points in their lives than Gen Z who are mainly still at home. Gen Z tends to be less self-reliant and because they are home, I believe, they have access to more tech and services than Millennials. 


Charlene: Is Gen Z as large an influence to the culture as Boomers were to theirs?


Peter: It’s hard to say right now. I think Boomers lived through some different times and that makes it hard to compare. So many things have changed between generations, whether based on historical events or technological advancements. Only time will tell.


Charlene: What are the major attitudinal attributes of Gen Z?


Peter: They are definitely growing up in a more technologically advanced time than prior generations.  I happen to be the parent of Gen Z’er and I definitely see their need to constantly stare at screens both large and small. Wherever you go, you see this young generation being entertained by a device whether it be in a restaurant, shopping cart, at home - pretty much anywhere! They are exposed to so much more because of technology and are "growing up" quicker than prior generations.  


Charlene: How do you see Gen Z impacting media and content consumption?


Peter: Again, it goes back to life stages.  and that makes it tricky. The younger Gen Z’ers are either at home or school and as they become teens, they are out of the house more. During this transition, their habits tend to change as well. Once they hit college, consumption changes completely.  Because they are growing up in this on demand world, their media habits are different than prior generations. College kids tend to be the lightest viewers of television, but do use the TV set for their connected devices like game consoles and multimedia devices for streaming content almost as much as prior generations. Gen Z’ers will likely have similar digital use as millennials as they age, but the question still is if younger generations will look like the older ones, or will older ones change and adopt younger behaviors. It’s a lifelong study.


Charlene: How do you see Gen Z impacting ad consumption?


Peter: I think it all depends on what media they are consuming and which platform. Some platforms or services are more ad supported. For example, if we see they are only watching SVOD services, then they would be exposed to fewer ads. But they are watching or listening to media across all platforms. They are increasingly using game consoles and multimedia devices.  We can assume they are increasingly using digital devices like the younger millennials as well. Depending on how ads are served on those platforms would play a role with their impact. 

This article first appeared in www.MediaVillage.com